Earth in focus
How to interpret images of Earth from space
Grades 4 to 8 (Ontario)
Elementary cycle 2 to Secondary cycle 2 (Quebec)
The online activities included in this kit were developed to support learning associated with the travelling exhibition Earth in Focus: Insights from space. The exhibition was developed by Ingenium in partnership with the Canadian Space Agency and focuses on Earth observation from space. The activities are available for use to anyone, but are especially useful to introduce students to the concepts of Earth observation and remote sensing before a visit to the exhibition. The activities are intended for students in grades 4 to 8; however, activities can also be adapted for use with any grade level.
For decades, scientists have been using space technology to observe and study our planet. From the first photograph of Earth taken in 1946 to today’s advanced satellite imaging, Earth observation has evolved dramatically. Modern satellites collect detailed data on temperature, atmospheric gases, land elevation, and sea levels, helping us better understand environmental changes.
This lesson plan introduces students to the concept of remote sensing and the different technologies used to observe Earth. Through engaging activities, they will explore how satellites, drones, and other platforms provide crucial information for weather forecasting, climate monitoring, and environmental protection.
Share :
Earth observation
We have been observing Earth from space for many years. Over this time, the technologies used to do so have changed dramatically. The very first picture of Earth from space was taken on October 24th, 1946 from a rocket 105 km above the ground. The rocket, from World War II, had the warhead replaced with a package of scientific instruments including a 35 mm motion-picture camera that was set to snap a picture every 90 seconds. The images were dropped back to Earth in a tough steel canister.
Our technologies and capabilities have certainly improved since the first picture was taken. The iconic “The blue marble” taken by astronauts aboard the Apollo 17 in 1972 was the first full view of the Earth and was taken while Apollo was on its way to the moon. In more recent times, satellites a little closer to Earth, about 824 km up, take composite images of Earth allowing for more detail, taking pictures as they repeatedly orbit the Earth. Since the first satellite was launched in 1957, many have been sent into space to collect data about the Earth. We have progressed from only being able to take photographs of Earth to collecting complex information such as temperature, concentrations of atmospheric gases, exact elevations of land and sea levels, and much more.
Remote sensing refers to the collection of data from a distance. Many different types of sensors, on different types of platforms, can be used to observe the Earth from above. Types of platforms that are used to perform Earth observation include drones, airplanes, stratospheric balloons, and satellites. The term “remote sensing” is most often used to imply Earth observation from a satellite.
The first Earth observation satellite was a weather satellite called TIROS 1 (Television Infrared Observation Satellite). It was launched by NASA in 1960 and equipped with cameras to take images of Earth’s atmosphere. This led to the development of real-time video surveillance for other purposes, such as geographic observation and military intelligence. Later, the first satellite devoted to monitoring land – Landsat 1 – was launched by NASA in 1972.
Later, the first satellite devoted to monitoring land – Landsat 1 – was launched by NASA in 1972.
Earth observation (or EO) is the term given to the collection of information about our Earth systems via remote-sensing technologies. EO can include both space-based as well as ground or air-based data.
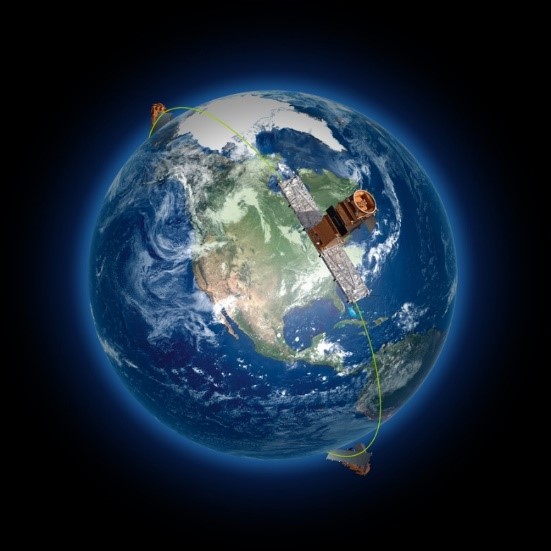
Canada launched its own Earth Observation (EO) satellite, RADARSAT-1, in 1995 followed by its successor, RADARSAT-2 in 2007. In 2019, the RADARSAT Constellation Mission (RCM) was launched. It consists of three identical satellites that work together to observe Earth as never before. RCM is designed to provide effective solutions in three main areas: maritime surveillance (ice, surface wind, oil pollution and ship monitoring), disaster management (mitigation, warning, response and recovery), and ecosystem monitoring (agriculture, wetlands, forestry and coastal change monitoring.)
Scientists have been asking questions about Earth’s systems and collecting data from satellites to study Earth’s changing environment for many years. Engineers help design instruments to get the measurements needed to help answer scientists’ questions, giving us a variety of instruments used to get the big picture of our Earth system.
As was already mentioned, different sensors are used to observe the Earth. Satellites orbiting the Earth carry sensors that measure data using different sections of the electromagnetic spectrum.
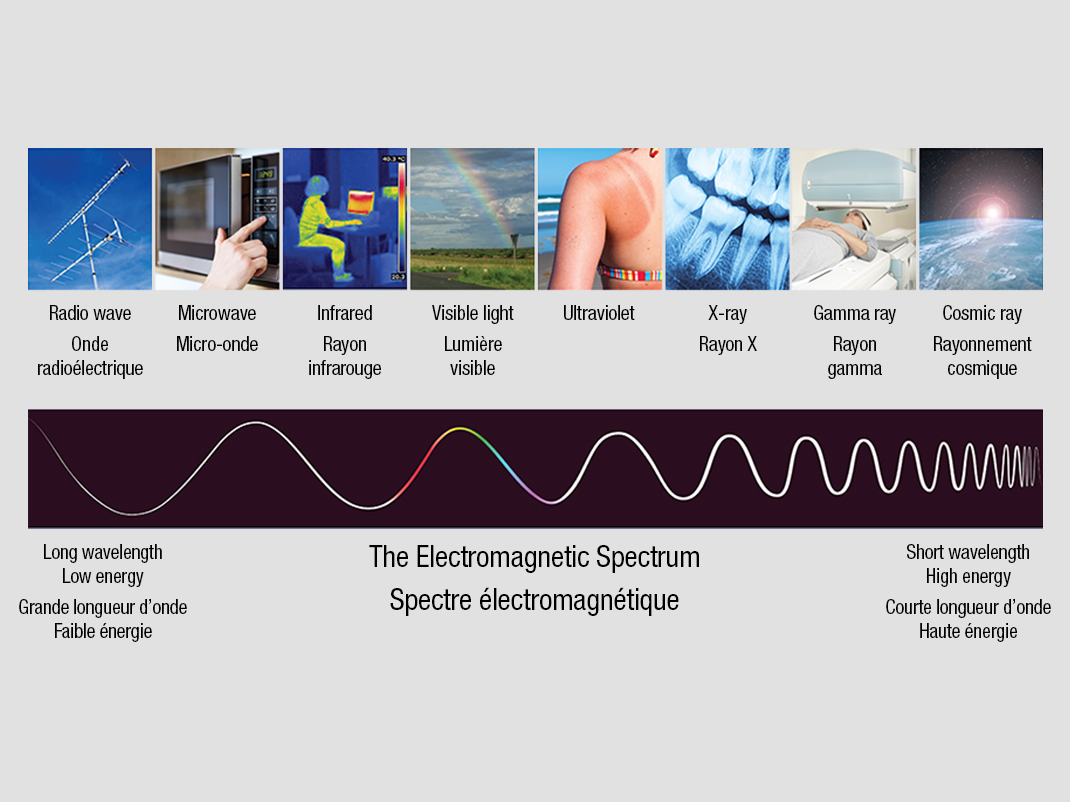
Electromagnetic energy travels in waves and spans a broad range, from very long radio waves to very short gamma and cosmic rays. Humans can see only a small portion of the spectrum – this portion is called visible light and is what astronauts and their cameras would observe. Satellites use a broad range of the spectrum to study the Earth. Remote sensing of Earth most frequently uses energy in the visible, infrared (IR), and microwave portions of the spectrum.
- Gamma rays or Cosmic rays: are not used to study the universe.
- X-rays: are used to photograph and study the sun.
- Visible light: is used to take true colour images of the Earth and its features.
- Infrared: is used to view and track hurricane paths, since it is not affected by cloud cover, and for measurements of the Earth’s land and sea surface temperatures.
- The microwave portion of the spectrum is the most useful for Earth observation remote sensing.
- Microwave instruments are able to sense much longer wavelengths
- Microwaves are able to penetrate clouds which can completely block a satellite’s view in the visible and infrared spectrums
- They are used to observe clouds, precipitation, and water vapour, monitor land and sea surfaces and perform atmospheric profiling of temperature and humidity.
- Radio waves have the longest wavelength and lowest frequency. RF sensors can provide continuous coverage, day and night, irrespective of the cloud coverage. RF remote sensing provides data on weather forecasts, climate change, and disaster management among others.
Supplemental information
Satellites can include active or passive sensors.
- Passive sensors detect natural energy that is emitted (released) or reflected by the object that is being observed. (For Earth observation sunlight would be the most common source of energy being measured by passive sensors.)
- Active sensors provide their own source of energy to illuminate the objects they observe. The sensor will detect and measure the energy that is reflected back from the target. Different sensors are equipped to measure different parts of the electromagnetic spectrum. For example, our eyes (passive sensors) can only detect wavelengths that are part of the visible spectrum (the colours of the rainbow) but some satellite sensors can also detect ultraviolet and infrared light among others.
Activity: How to interpret images of Earth from space
Learning objective
To demonstrate to students how it can be difficult to interpret an image of Earth from space.
Introduction
In recent years, the general public has been lucky to have much more access to photos from space and satellite images. Google Earth and space agencies around the world provide us with images of Earth from space. We can see how cities are changing, the effects of storms in far away places or at home, and even see how crops are growing. Really understanding the images though isn’t always as easy as it may seem. Sometimes, without proper context, our eyes can play tricks on us!
Check out the printable PDF at the bottom of the page for more info!

Astronauts can be disoriented in space especially at the beginning of their mission. For this reason, they are trained extensively to be able to orient themselves relative to Earth and to identify features. Knowing how to look at the Earth also provides them with an important psychological advantage of remaining connected to home. During their training astronauts are reminded that what they will be recording will be used for scientific purposes and will contribute to research being done around the world.
There are some key tips to help us make sense of what we are seeing.
1. Look for scale
Some images may be very detailed and zoomed in to one specific area while others are the opposite and show a wide-angle view of an entire ecosystem.
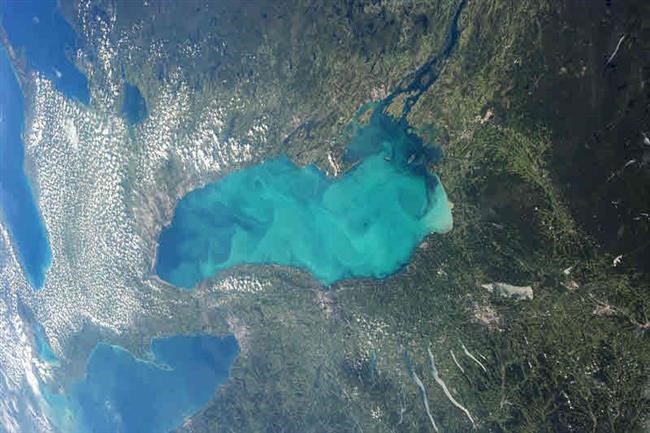
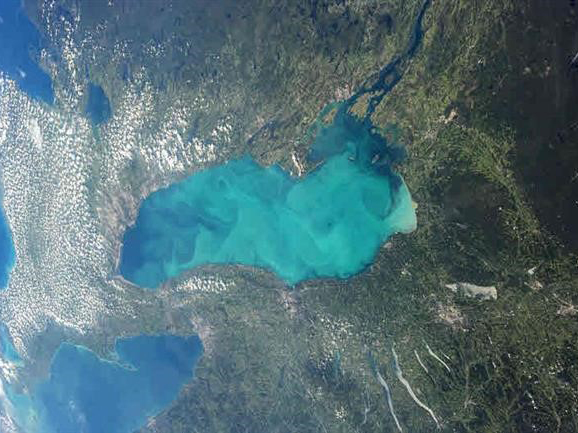
In this image we could think we were looking at a pond in the Caribbean when in actual fact it is an image focussing on a very large area with one of the Great Lakes (Lake Ontario) in the centre and includes part of Lakes Huron and Erie and shows Chatham, London, Niagara Falls, Toronto, part of Algonquin Park, Kingston and beyond as well as part of NY state including Buffalo, Rochester, Syracuse and Watertown.
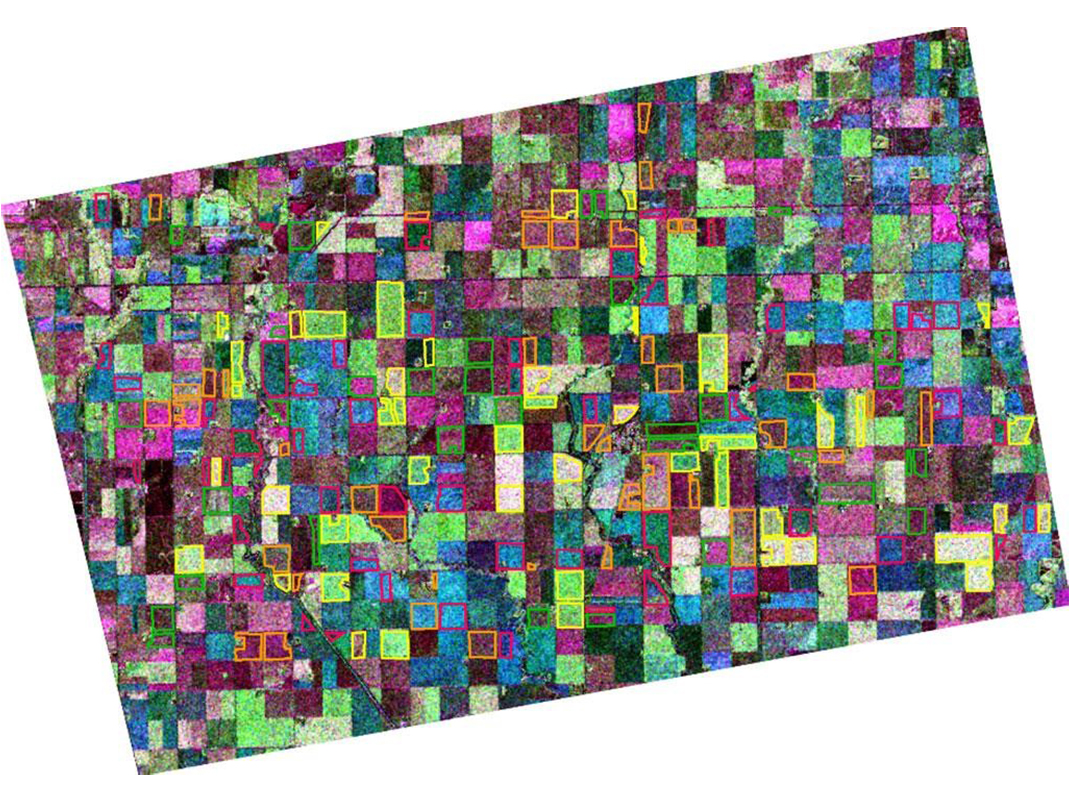
2. Look for patterns, shapes and textures
Bodies of water (lakes, rivers, etc.) are often the easiest to identify; farms will often have regular geometric shapes, geological shapes may be easy to find (circular volcanoes and craters, long wavy lines of mountain ranges).
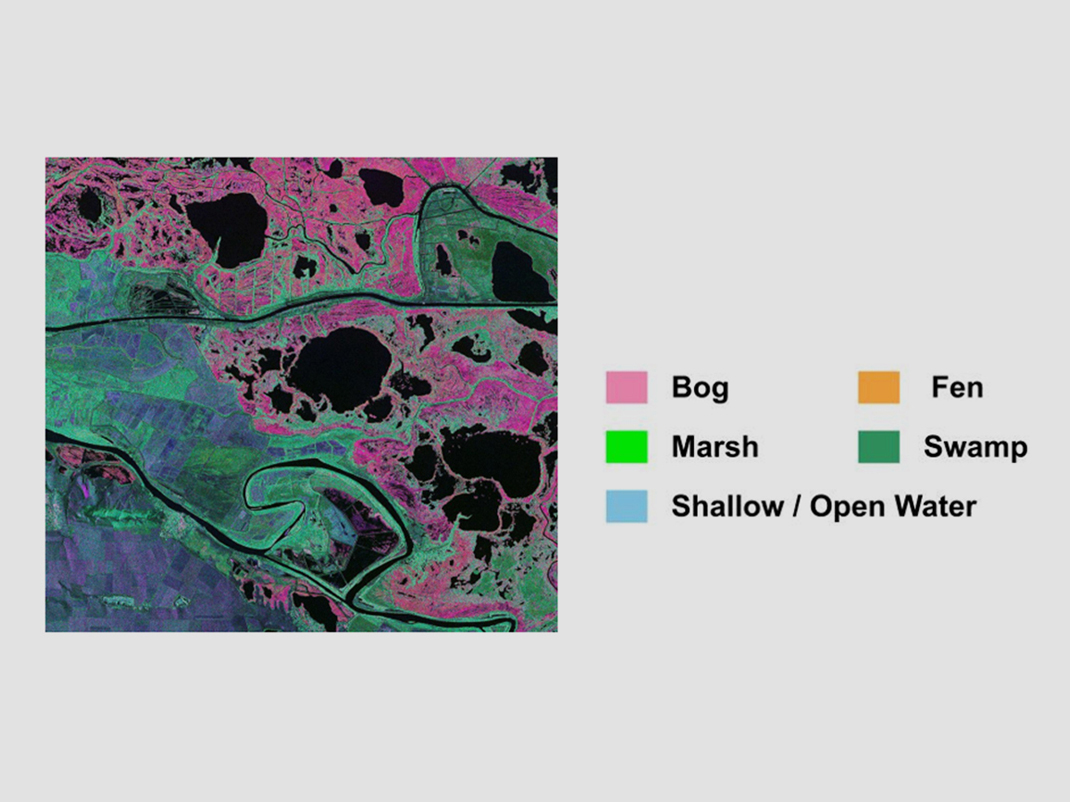
3. Define the colours
The colour in images will depend on what kind of light the satellite instrument measured. True-colour images use visible light and are similar to what you would see from space. False-colour images incorporate infrared light and may take on unexpected colours – since infrared light is ‘invisible’ to human eyes these types of light are assigned visible colours to represent them. In a true colour image plants are usually different shades of green but land used for agriculture may often be much brighter than natural vegetation. Sunlight reflecting off water makes it look gray, silver or white.
It would be very difficult to tell what you were looking at in the above image without a guide to show you the meaning of the colours.
4. Find north
Try to figure out what you are looking at by identifying features and whether other features are north or south of that etc.
5. Consider your own knowledge
This is probably the most helpful in identifying key features and requires lifelong learning and practice.
Instructions
There are many ways to direct this activity and adjustments can be made by age:
- The activities are on the accompanying slides and can be projected to be completed as a class activity.
- Students can be assigned the activities online through Google Forms.
- Questions can be printed and students can work alone or in groups.
- Images can be used for many different types of activities: describe the image; identify features in the image; etc.
Go further!
- For older students, satellite images can be used to determine distances between features. Instructions to do so can be found on the Natural Resources Canada website.
- Landsat science NASA resources
Activity: Engineer your own CubeSat
Learning outcomes
In this activity students will learn what CubeSats are and why they are used. They will then work in groups to design and build a prototype of a CubeSat, ensuring that their design meets the criteria and testing requirements to ensure viability.
Introduction
Scientists have been asking questions about Earth’s systems for over 50 years and collecting data from space-based satellites to study Earth’s changing environment. From scientists’ questions, engineers help design instruments to get the measurements needed to help answer these questions. A variety of instruments are used to get the big picture of our Earth’s systems. Since one satellite can only carry a limited number of instruments at one time, due to size and weight constraints, multiple satellites are used to collect data over the entire globe every day.

The Canadian CubeSat Project was announced in 2017. It provides post-secondary students with the opportunity to engage in a real space mission. Through a national competition, winning teams of professors and students are offered the opportunity to design and build their own miniature satellite called a CubeSat. The purpose of this program is to increase students’ interest in STEM, develop their expertise in this field, give them hands-on experience and advance space science and/or technology. Unfortunately, the actual competition is only available to post-secondary students, but that doesn’t mean your class can’t make some CubeSat designs. For more information on the CubeSat program visit Canadian CubeSat Project.
A CubeSat is a square-shaped miniature satellite (10 cm x 10 cm x 10 cm), weighing about 1 kg. A CubeSat can be used alone or in groups of multiple units with up to 24 together.
CubeSats are custom built to the specific requirements of their mission. The main structure is made of aluminium and serves to hold the antenna and radio communication system, the power source and computer along with any sensors or scientific instruments. Antennas and solar panels can be installed on the exterior of the structure. CubeSats are often sent into space using extra space available on rockets. The smaller the satellite, the lower the associated cost for assembly and launch. These satellites can be built quickly, are less expensive, use simple technology, and are easier to design. However, they have a reduced capacity to carry scientific instruments and have fairly short mission durations (typically less than 12 months).

Testing
In the real-world, if it is financially possible, teams who are working on CubeSats will build multiple units: two flight units, an Engineering Test Unit (ETU), and a FlatSat. The ETU is built like a flight unit but is not intended for launch. It is a type of practice dummy. It is used to make sure parts fit together properly and for hardware and software testing. Any testing or trial that has to be done will be done first on the ETU to help protect the valuable flight unit. The FlatSat includes all the components of the CubeSat but not the structure. Typically, the components are mounted onto a flat board and then testing and troubleshooting can be performed without having to integrate the components onto the structure. All preliminary testing will be performed on the ETU and FlatSat and then final environment testing can be done on the flight units. Two flight units are fabricated, if possible, to provide an option to fly the best hardware since no two satellites will be exactly the same. Before a CubeSat is accepted for flight it must complete Verification Testing to prove that it is safe and sturdy. Verification Testing typically includes vibration and thermal testing, testing of electrical components and can include shock, static load, and more.
Since we don’t have the ability to test as they do in the industry we will use other ways to test the viability of the designs. Prototypes can be tested to failure if desired or many tests can be performed. This could be a discussion in class. Some possible tests:
- Drop the CubeSat from a height of 2 m. Ensure the body is still 10cm x 10 cm x 10 cm after the test and payload are in place. If testing to failure is desired, a record can be kept of the maximum height of fall before failure.
- Place weight on top of the CubeSat. Recommended weight is 2 Kg. Ensure the body is still 10cm x 10 cm x 10 cm after the test and payload are in place. If testing to failure is desired, multiple weights can be placed on the model until failure and then the weights that were on the model before the one that caused failure can be weighed.
- The CubeSat can be placed in a salad spinner and spun around for a given amount of time. Ensure the body is still 10cm x 10 cm x 10 cm after the test and payload are in place.
- Any other test that seems like it might provide worthwhile results.
Activity description
The following are some general guidelines and ideas for construction and testing. Depending on the interests of your class, or the materials available to you, you may want to add or omit certain aspects of the construction or testing. Do what works for you and your class!
CubeSat design
- The cube needs to measure 10 cm x 10 cm x 10 cm
- You must be able to open the cube so that the sensors and scientific instruments can be placed inside.
- When completed the cube will be weighed and must be less than 150 g.
- To test its strength the cube will be subject to a load (est. weight of 2 kg) placed on top and must maintain its shape.
- To also test its strength the cube will be dropped from a height of 2 m and again, must maintain its shape
- The model can be covered in foil to simulate the satellite thermal shields used to protect the delicate on-board instruments from the extreme temperatures of space.
- The CubeSat prototype should include a payload (this could consist of a AA battery and a ‘computer board’ fabricated using LEGO or cardboard) that needs to be secured within the prototype so that it is not dislodged during testing.
Satellite prototype: Suggested material
- Body: Cardboard, aluminum foil, craft sticks, straws, rulers, duct tape, masking tape, hot glue
- Payload: AA battery, payload simulation material (LEGO pieces, string, wool, buttons, cardboard, etc.), duct tape, wire, glue, etc. to secure
Testing material
- Digital scale
- Weight (large text book, full bottles of water on a tray, etc.),
- Measuring tape or metre stick
- Other test material depending on tests being performed such as a shake table or salad spinner.

Testing procedure
- Weigh the prototype
- Place the weight on top of the CubeSat prototype (ensuring that the load is distributed across the top and not applied at a point)
- Drop the prototype from a distance of 2m.
- If at any point the prototype does not retain its shape students can revise their model based on observations during testing and discussion with their peers
- A new model can be fabricated for final testing
Go further
Videos about CubeSats in English:
- JPL’s Crazy Engineering: CubeSats from NASA’s jet propulsion laboratory. 2 minutes and 49 seconds
- TedTalk Tiny Satellites. 8 minutes and 5 seconds
Videos about CubeSats in French:
- Les Nano-Satelllites 8 minutes et 54 secondes
- ESA Euronews: Les nanosatellites jouent dans la cour des grands ESA Euronews: Les nanosatellites jouent dans la cour des grands 8 minutes et 30 secondes
Printable PDFs
Earth in focus lesson plan (PDF, 5 MB)
You may also be interested in

Agriculture and the environment
Explore the vital connection between agriculture and the environment with this engaging lesson plan. Students will investigate how farming impacts ecosystems, how scientists and farmers collaborate to reduce negative effects, and how climate change is shaping Canadian agriculture.

Pulleys and gears
Get your students in gear and lift them to new heights while exploring how pulleys and gears help us do work more easily.
Electri-city
Spark curiosity in your students with this interactive electricity lesson plan! Through hands-on experiments and engaging activities, they’ll explore charged materials, simulate electric currents, and build working circuits—bringing science to life in your classroom!